Steel Plate Defect Prediction
Sep 15, 2024
Introduction
Today is the fourth day of 30 Kaggle Challenges in 30 Days challenge. Today we will concentrate on the feature engineering of the dataset to improve the performance of the model.
Problem Statement
Build a classifier to identify the type of steel plate fault. Kaggle have provided a synthetically generated dataset from the dataset of steel plates faults from UCI Repository. The steel plate have 7 types of faults and the task is to build a classifier to identify the type of faults in test dataset. The evaluation metric for this competition is area under the ROC curve.
To calculate the final score, AUC is calculated for each of the 7 defect categories and then averaged. In other words, the score is the average of the individual AUC of each predicted column.
- Kaggle Dataset: Playground Series: Season 4, Episode 3
- UCI Repository Dataset: Steel Plates Faults
Data Exploration
Two datasets have been provided, train and test. The sizes of the datasets are as follows:
| Rows | Columns | |
|---|---|---|
| Train | 19219 | 35 |
| Test | 12814 | 28 |
The seven extra columns in the train dataset is the seven types of faults in steel plates. In the submission, the probability of each of those fault in test data have to be submitted.
If id column is removed from analysis, there are total 27 features. The detailed description of these features are not provided. I check on the UCI Repository, but there also detailed description has not been provided.
Exploratory Data Analysis
Distribution of Steel Plates
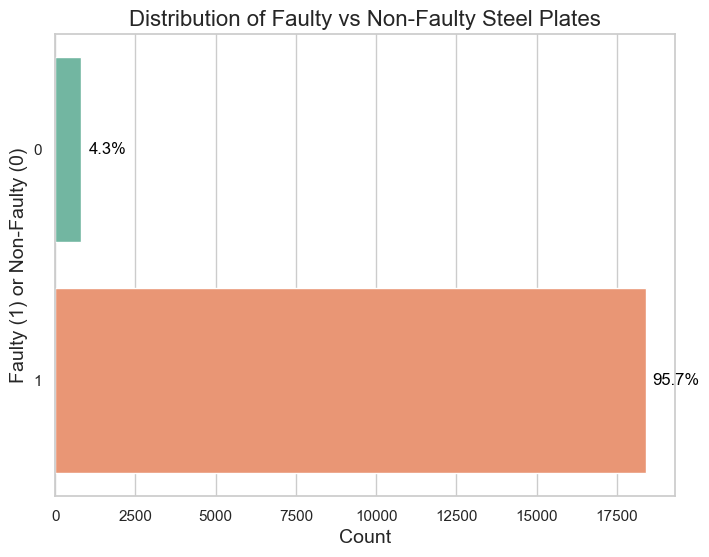
The dataset does not have any missing values. All the features are numerical. I checked the total number of faulty plates in training set.
| Fault Present | Count |
|---|---|
| Yes | 18401 |
| No | 818 |
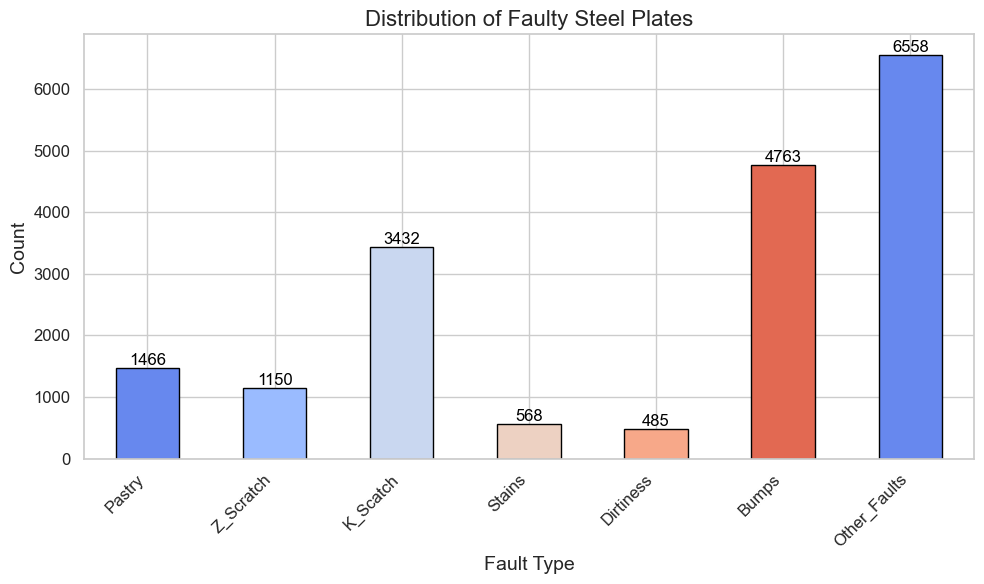
Distribution of Faulty Steel Plates
Models
Logistic Regression
The first model I tried is logistic regression. When I run logistic regression I stumble upon first problem. I can’t run logistic regression for multi label classification problem. So I have to wrap it in OneVsRestClassifier.
Random Forest Classifier
This is the next model I tried where I learned that in tree based classifier (lie Random Forest), in multi-label classification, predict_proba will return a list, where each entry corresponds to the predicted probabilities for each class. You need to loop through each label and extract the second column of probabilities for each class (since predict_proba returns two columns: one for class 0 and one for class 1). Following code was used to extract the probabilities of the positive class (index=1) for each class.
auc = roc_auc_score(y_test[:, i], preds[i][:, 1])Validation Result
I train total 9 models in initial run. The score are as follows:
| Model | Fold 0 AUC | Fold 1 AUC | Fold 2 AUC | Fold 3 AUC | Fold 4 AUC | Avg AUC | Avg Time (seconds) |
|---|---|---|---|---|---|---|---|
| logistic_regression | 0.8652 | 0.8564 | 0.8633 | 0.8587 | 0.8553 | 0.8598 | 0.32 |
| random_forest | 0.879 | 0.8747 | 0.8732 | 0.8726 | 0.8699 | 0.8739 | 7.75 |
| xgboost | 0.8766 | 0.8721 | 0.8725 | 0.8719 | 0.8722 | 0.8731 | 1.18 |
| lightgbm | 0.8851 | 0.8822 | 0.8802 | 0.8811 | 0.8801 | 0.8817 | 1.04 |
| catboost | 0.8888 | 0.8832 | 0.8838 | 0.8854 | 0.8831 | 0.8849 | 60.02 |
| mlp | 0.8709 | 0.866 | 0.8656 | 0.8692 | 0.8607 | 0.8665 | 30.3 |
| gradient_boosting | 0.8866 | 0.8832 | 0.883 | 0.8865 | 0.8787 | 0.8836 | 34.72 |
| knn | 0.7829 | 0.786 | 0.7817 | 0.7789 | 0.7803 | 0.7819 | 0.69 |
| svm | 0.8268 | 0.8313 | 0.8238 | 0.8282 | 0.8251 | 0.827 | 163.8 |
Among all model, catboost performs the best. Hence I decided to do feature engineering and test on this model.
Feature Engineering
I have tried the following new features improvement.
X['X_Range'] = X['X_Maximum'] - X['X_Minimum']
X['Y_Range'] = X['Y_Maximum'] - X['Y_Minimum']
X['Area_Perimeter_Ratio'] = X['Pixels_Areas'] / (X['X_Perimeter'] + X['Y_Perimeter'])
X['Luminosity_Range'] = X['Maximum_of_Luminosity'] - X['Minimum_of_Luminosity']
X['Volume'] = X['X_Range'] * X['Y_Range'] * X['Steel_Plate_Thickness']
X['Thickness_Deviation'] = X['Steel_Plate_Thickness'] - self.mean_thickness
The performance did not increased after adding new features. Some of the reasons are as follows:
- The new feature might now have added any new information to the model, as all the features have explained most of the variation.
- The data is already cleaned and pre engineered, because the main dataset is used in academic setting.
Result
Catboost is selected for final submission. I train it on full training data and predicted probabilities on testing data for submission. These are the score.
Model: Catboost
Score: 0.88169
Ranking Range: 950-951
Key Learning
- Not all model support multi label classification.
- The predict methods returns different data types for different model, so be cautious and double check if you are using correct format.
- Feature engineering is not always necessary.
Conclusion
This was the first multi label problem I tackled since I started solving playground problem. I learned a lot by solving new type of problem. I added one more file to increase the automation. Hopefully tomorrow I will solve the problem little faster.
Links
Notebook: Kaggle Notebook for S4E3
Code: GitHub Repository for Day 5