Educational Lead Conversion
Created on: Aug 16, 2024
Project Overview
X Education sells online courses but struggles with low lead conversion rates, which are typically around 30%. This project focuses on building a machine learning model to identify high-potential leads, “Hot Leads,” so the sales team can focus their efforts. By predicting the leads most likely to convert, the company aims to increase its conversion rate to approximately 80%.
A typical lead conversion process can be represented using the following funnel:

The diagram above illustrates that while many leads are generated at the initial stage, only a small portion convert into paying customers. In the middle stage, nurturing potential leads through education about the product and continuous communication is crucial to improving the lead conversion rate.
Objective
The goal of this project is to build a model that assigns a lead score to each lead, such that customers with higher lead scores have a greater chance of conversion. This allows the sales team to prioritize their efforts on the most promising leads. The CEO has set an approximate target for the lead conversion rate, aiming for 80%.
Data
A historical dataset with approximately 9,000 data points is provided. This dataset consists of various attributes such as Lead Source, Total Time Spent on Website, Total Visits, Last Activity, and more, which may vary in relevance to predicting lead conversion.
The target variable is the ‘Converted’ column, indicating whether a lead was converted (1) or not (0). These attributes reflect different aspects of user behavior and engagement, which can provide insights into lead conversion likelihood. This dataset will be used to train the machine learning model and evaluate its performance.
Exploratory Data Analysis
For detailed code on data loading and exploration, check the data_exploration.ipynb
Technical Approach
Logistic regression was chosen for its simplicity and interpretability, making it an ideal choice for binary classification. Recursive Feature Elimination (RFE) was used to select the most important features that impact lead conversion, enhancing model performance by removing irrelevant variables.
- Tools Used: Python, Pandas, Scikit-Learn, Matplotlib, Streamlit
- Key Algorithm: Logistic Regression with Recursive Feature Elimination (RFE)
I followed the following steps to build the model:
- Create a stratified k folds for cross validation to ensure robust evaluation of the model across different subsets of data.
- Drop
Prospect IdandLead Numbercolumns. - Replace
Selectvalues in many feature columns with NaN. - Drop columns with a single unique value that don’t contribute to the variance.
- Impute the missing values with most frequent (mode) values.
- Map binary values (
YesandNo) in the feature columns to1and0. - Convert the numerical columns to numeric type.
- Scale numerical columns using
StandardScaler. - Encode categorical columns using
OneHotEncoder. - Train the logistic regression model, applying recursive feature elimination.
See the full cleaning process in data_cleaning.ipynb.
Model Features
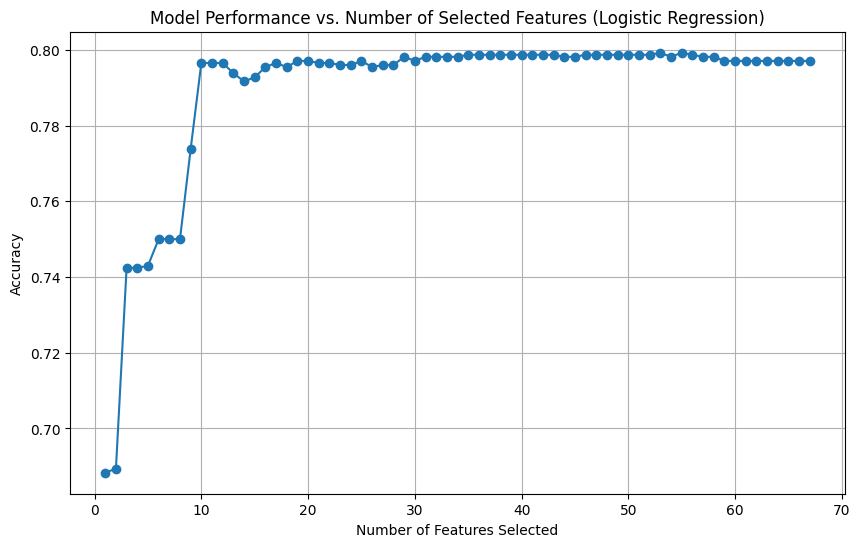
I tested the model with varying numbers of features and found that after selecting 10 or 11 features, the model’s accuracy stabilized, as shown in the graph below. There was no significant improvement in accuracy beyond this point. Therefore, I selected 11 features as the optimal number for the model.
VIF (Variance Inflation Factor) helps detect multicollinearity between features. A VIF close to 1 indicates no correlation, while a value above 5 suggests high multicollinearity, which we aim to avoid. Reducing multicollinearity ensures each feature contributes independently to the model’s predictions, improving both interpretability and performance.
The variation inflation factor (VIF) for the finalized features is as follows:
                                           Feature       VIF
0                                            const  2.171984
1                                     Do Not Email  1.019810
2                      Total Time Spent on Website  1.250886
3                        Lead Origin_Lead Add Form  1.314201
4                           Lead Source_Olark Chat  1.442906
5                     Lead Source_Welingak Website  1.229586
6                  Last Activity_Converted to Lead  1.050732
7           Last Activity_Had a Phone Conversation  1.880260
8            Last Activity_Olark Chat Conversation  1.267395
9   Last Notable Activity_Had a Phone Conversation  1.876032
10                  Last Notable Activity_SMS Sent  1.080171
11               Last Notable Activity_Unreachable  1.002601
All VIF values are well within the acceptable range, ensuring the model is not affected by multicollinearity.
Installation & Usage
- Clone the repository:
git clone https://github.com/surajwate/Education-Lead-Conversion-Model.git - Install dependencies using Poetry:
poetry install - Run the Streamlit app locally:
streamlit run streamlit_app/app.py
You can also try the live demo here.
Streamlit App
An interactive app was built using Streamlit to allow users to input lead details and get conversion predictions. This enables sales teams to prioritize leads more effectively.
- Try it out the interactive app: Lead Conversion Prediction with Streamlit App
Code for the app is available in app.py.
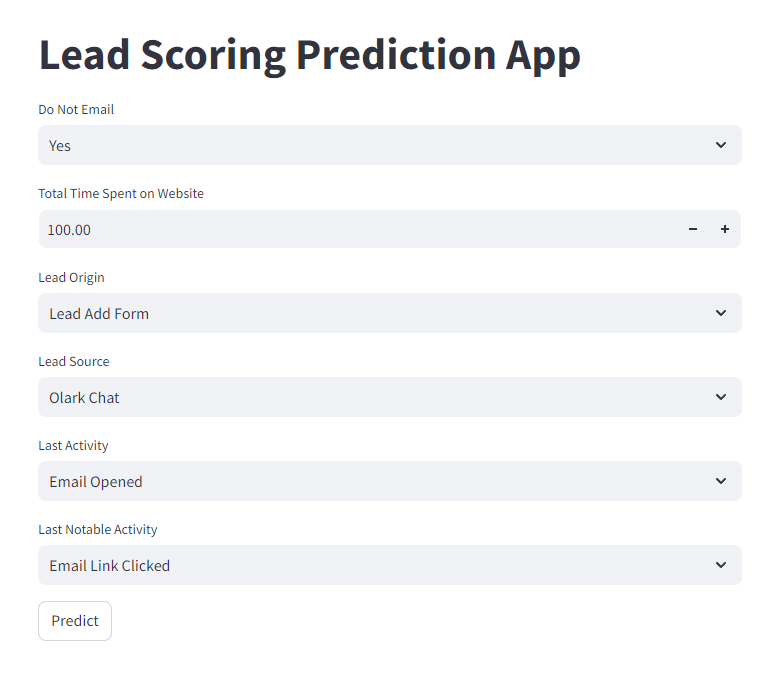
Figure 1: User Interface of the Lead Conversion Prediction App.
Model Performance
I have calculated the best score at various threshold levels, but the threshold can be adjusted based on the specific problem requirements. Adjusting the threshold allows the model to balance precision and recall, depending on business needs.
You can check the full code in the logistic_model_evaluation.ipynb file.
Best F1-Score threshold: 0.3518018018018018, Best F1-Score: 0.7447368421052631
Best Accuracy threshold: 0.4528828828828829, Best Accuracy: 0.801948051948052
Best Precision threshold: 0.9840540540540541, Best Precision: 1.0
Best Recall threshold: 0.0, Best Recall: 1.0
Best threshold (Recall ≈ Precision): 0.4608108108108108
For our project, we require maximum precision and accuracy. Therefore, I selected a threshold of 0.62 for the model, as this offers the best balance between these metrics. (You can check this in the main.py file of the project.)

Figure 2: Metrics vs. Threshold for the Lead Conversion Model.
Conclusion & Future Work
The Education Lead Conversion Model effectively predicts the likelihood of lead conversion, providing valuable insights that help educational institutions focus their marketing and sales efforts on high-potential leads. This leads to more efficient resource allocation and improved conversion rates.
In the future, enhancements could involve testing more advanced algorithms such as Gradient Boosting Machines or neural networks to achieve potentially higher accuracy. Additionally, expanding the feature set to include more engagement metrics (e.g., user activity, click-through rates) could further improve prediction quality.
Although this project was successful, one area of improvement is the use of machine learning pipelines. Incorporating pipelines would have streamlined the process, making the model more efficient and easier to deploy. In future projects, I plan to implement pipelines to automate the workflow, from data preprocessing to model evaluation, streamlining deployment and making the solution more scalable and production-ready.
Interested in learning more?
Explore the full codebase on GitHub here.